Visible Learning by John Hattie (2009) is well-described by its subtitle: “A synthesis of over 800 meta-analyses relating to achievement”. It is an attempt to summarise a huge amount of educational research about what works and what doesn’t into a single volume. This post is my review/analysis of the book.
The concept of the book sounded excellent: a meta-meta-analysis. To unpack that: a single study might look at some students and the effect that a particular change (e.g. requiring students to have an iPad) had on their achievement. But a single study can be biased by having a small sample, or various confounds (e.g. students’ familiarity with iPads). A meta-analysis looks across many studies of a particular change, to try to get a more reliable sense of the effect. Hattie’s Visible Learning aimed to be a meta-meta-analysis: a look at a huge array of meta-analyses to get a good picture of what works in education and what doesn’t.
The effort is massive, and commendable. However: I believe that the methodology is frequently flawed. Hattie’s book relies on averaging and comparing a statistical measure called “effect size” across meta-analyses. I am not a statistics expert, but my best understanding — explained, and supported with examples below — is that Hattie repeatedly averages and compares effect sizes where it is inappropriate to do so. Because of this, I am not confident in the conclusions that the book draws. Read on for more details of what effect sizes are, how you should handle them, and the problems with how Hattie processes them.
Effect Sizes
Visible Learning is centred around a statistical measure called “effect size”, and so are my criticisms. There are several measures of effect size — Hattie uses one of the most popular: Cohen’s d. Simply, it’s a measure of how much two groups differ on a particular measurement. It’s defined as:

You can read this as a measure of how many standard deviations the mean was shifted. For example, imagine you have a class learning French, and you take them to France on a two week trip. Beforehand, their average score on a French test is 5.5 out of 10, after the trip it’s 7 out of 10, and the standard deviation is 2 marks in both cases. This corresponds to an effect size of 0.75 (
Inappropriate averaging and comparison
A meta-analysis is a way to rigorously and quantitatively summarise a bunch of research studies, usually by way of effect sizes. Typically, you find a set of studies measuring a similar outcome, with a similar manipulation, find their effect sizes and average all the effect sizes to get a mean effect size. Crucially, there is an onus on the authors to not just average every study they find. Here’s Coe (2002) discussing effect sizes in meta-analyses (emphasis mine):
One final caveat should be made here about the danger of combining incommensurable results. Given two (or more) numbers, one can always calculate an average. However, if they are effect sizes from experiments that differ significantly in terms of the outcome measures used, then the result may be totally meaningless. It can be very tempting, once effect sizes have been calculated, to treat them as all the same and lose sight of their origins… In comparing (or combining) effect sizes, one should therefore consider carefully whether they relate to the same outcomes… one should also consider whether those outcome measures are derived from the same (or sufficiently similar) instruments and the same (or sufficiently similar) populations.
These are important points, and from reading Visible Learning I am not confident that Hattie has followed this advice. My criticisms in the rest of the review relate to inappropriate averaging and comparison of effect sizes across quite different studies and interventions. This is not a minor issue: the whole book is built on the idea that we can look across these meta-analyses to find the most effective interventions by comparing average effect sizes.
Averaging measures of different outcomes
One oft-debated question is: does gender matter to achievement? Hattie concludes that gender makes no difference: “The average effect size across 2745 effect sizes is 0.12 (in favour of males).” But what studies have been used to make the average? One of the gender papers is “How large are cognitive gender differences?” by Hyde (1981). It has two findings from its meta-analysis: girls have higher verbal ability with effect size 0.24 (so boys “ahead” by -0.24), but boys have higher quantitative ability with effect size 0.43. Hattie puts these values as -0.24 and 0.43 into his effect size average — if it was these two alone we would get 0.1 effect size, and agree with Hattie that there is no gender difference. But the effect sizes are tests of different ability; averaging them loses vital detail. The correct thing to do (as Hyde did) is to calculate two separate effect sizes, one for each test.
Invalid effect size comparisons
Hattie sets out at the start of the book to decide which effect sizes are worth paying attention to. He chooses 0.4 as his benchmark value for two main reasons. The first reason is that 0.4 is the average effect size of all the meta-analyses included in the book, so being above this threshold means the effects are in the top half of those covered in the book. That relies on the assumption that all the effect sizes can be compared to each other, which is problematic, as we will see below. (And Hattie does make the assumption: the book ends with a giant table ranking all the effect sizes against each other.)
The second reason that Hattie uses 0.4 as his benchmark is that the average improvement year-on-year among students is an effect size of 0.2 to 0.4. Hattie argues that an effect size of, say, 0.1 would be a decrease on the normal academic progression, and we should aim to beat the 0.4 mark. Which might be fine, for studies that are one year long and measure improvement in students across all subjects during one school year.
But let’s take the summer school statistics as an outcome. The difference between students before and after a summer school has an effect size of 0.23. If we are directly comparing effect sizes then we are left with the message that summer schools produce a similar gain in achievement to the rest of the year’s schooling. Really? If this logic were correct, we could surely shut the schools for nine months, send the students to a single summer school each year, and not reduce their academic achievement! This example shows that Hattie’s assumption that we can compare effect sizes across all these different studies produces some nonsensical implications. Clearly, you can’t compare the effect size for a summer school to a full year’s schooling to decide if they are worthwhile.
In this case, I believe that a large part of the problem there is that the measure of academic achievement between school years is based on a widespread battery of tests, but this summer schools result tends to be based on a fairly specialised outcome, which is therefore easier to make gains on. In fact, looking at the Cooper et al. (2000) summer-school analyses that make up two of the three summer school meta-analyses in Visible Learning, one of them measures primarily reading and writing, while the other measures a mix of things including maths, but also self-esteem and attitudes to achievement. Here, I think the fault lies more in the original meta-analysis (combining different measures), but Hattie’s result is still suspect if it is based on bad data.
As another example, Hattie discusses the effect on achievement of the 3-month summer break in school in the USA: an effect size of -0.09 on student achievement. Hattie states that “Compared to all other effects, these are minor indeed.” This doesn’t seem to tally. If the effect size for a standard year’s schooling (above) is 0.2 to 0.4, then doesn’t this -0.09 effect size roughly mean that students are regressing between 25% and 50% of their school year’s achievement gains during the summer break? This doesn’t seem minor at all! Either Hattie dismisses this problem too easily, or the problem is that we can’t compare the effect size for the school year to the regression over the summer.
Comparing X/Y tests to pre-/post-tests
Another problem is that Hattie is mixing and matching all sorts of different studies. Some compare the pre-scores of students to post-scores: for example, before and after a summer school. Other studies compare students in treatment X (e.g. selective schools) to treatment Y (e.g. mixed ability schools). We would have different expectations of an effect in each case.
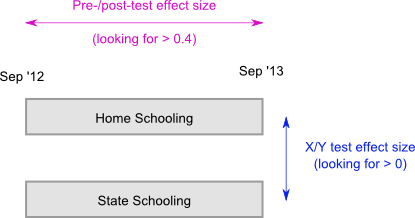
As in the diagram above, if we looked at the pre-/post- effect of a year of home schooling, we would be expecting at least 0.4 (since a normal year of schooling produces an effect size of 0.4). But if we compare students who have been home schooled against students who attended state schools, an effect size of 0.1 may well be worth it. But Hattie does not distinguish between these two origins of effect sizes when he ranks the effect sizes of different studies against each other. He is again comparing apples and oranges — a criticism covered in more detail here.
Increasing effect size by averaging split samples
Let’s return to the summer school example, and those two meta-analyses: one concerns remedial summer schools and one concerns “acceleration” summer schools for the gifted. This restriction of the samples is important — I want to explain the principle here, even though I’ve already pointed out that the latter meta-analysis measured something other than achievement.
If you look at an intervention for all students, they might have a standard deviation of test scores of, say, 15 percentage points. With a mean improvement of 5 percentage points on the test, you’ll get an effect size of 0.33 (5/15). If you look just at your most gifted students, they are likely to have a smaller standard deviation of test scores, say 5 percentage points, because they’re all at the top end with similar abilities. Now, a mean improvement of 5 percentage points produces an effect size of 1 (5/5). Similarly, a remedial summer school for your lowest achieving students will see them tightly clustered at the low end, so a standard deviation of, say, 10 percentage points with an improvement of 5 would score an effect size of 0.5 (5/10). So by using meta-analyses which have split samples, the effect sizes have gone up from 0.33 to an average of 0.75. But, as with the aforementioned gender paper, no consideration is given to this by Hattie: the two summer school meta-analyses get averaged together, into what is likely to be an inflated effect size. This is not a problem with the original meta-analyses per se, it is a problem with Hattie’s inconsiderate averaging of their results.
Effect sizes from different measures
The section “self-reported grades” reports an effect size of 1.44 — the highest effect size in the book. Worth paying attention to — but it took me a while to decipher what, precisely, the effect was referring to. I looked at one cited paper, “The Validity of Self-Reported Grade Point Averages, Class Ranks, and Test Scores: A Meta-Analysis and Review of the Literature” by Kuncel, Credé and Thomas (2005), which was listed as an effect size of 3.10 (huge!). Kuncel et al don’t use effect sizes directly; they are measuring correlations between a student’s actual grade and the self-reported grade. There is a conversion from correlation to effect size, but this is not a measure of the difference between two groups (like most of the rest of the book), it is a measure of matching. So the highest effect size in the book is not some miraculous intervention, it’s a measure of people’s honesty (who would have thought!), but Hattie ranks this in a table with things like effects of summer schools and difference between single- and mixed-sex schooling. Once again, the comparison makes no sense.
Effect sizes are vulnerable to the changes in standard deviation which occur in schools
Effect size is the mean difference divided by the standard deviation. Therefore, a change in standard deviation will affect the effect size. One complication in education is that standard deviation of ability tends to increase as you look at older students. As David Weston points out, effect sizes will therefore tend to get smaller as you look at later student years. So interventions at a very early age will appear to have a much larger effect (in terms of effect size) than interventions at a late age. It is not a problem specific to Hattie, but it yet again calls into question the practice of averaging and comparing effect sizes across interventions which may involve different age groups.
The noticeable error
There is additionally a noticeable error that crops up early in the book, on page 9. To help in understanding effect sizes more easily, Hattie added common language effect sizes (CLE) to the book. To re-use his example: to summarise the height advantage of adult males over adult females, the effect size is 2.0, but the CLE re-expresses this to say that there is a 92% chance that a randomly picked adult male is taller than a randomly picked adult female. Nice idea.
Unfortunately, that example is the only CLE in the book that is correct. All CLEs in tables throughout the book are wrong. CLE is a probability; Hattie’s tables have CLEs that are below 0% or higher than 100%. This post spotted the same problem and says the cause lay in Hattie’s algorithm that was calculating the CLE. I’m a programmer, I can see how this might happen when processing a large data set automatically, but there are also several CLEs described in text that are wrong (pages 9, 42 and 220), which is less forgiveable. It’s more of a side issue than all the problems discussed above, but at the time it wasn’t an inspiring start to the book.
Summary
The book is difficult to read from cover to cover, but I could see that it would be useful as a reference. You want to know about a particular intervention, say mixed-sex versus single-sex schools, and you flick to the appropriate section to see the conclusion: no major effect. You look up tracking (aka setting or streaming by ability): no major effect. However, given all above the methodological issues, I do not feel that I can trust any of the averaged effect size results in this book without digging further into the original meta analyses to check that they have been combined appropriately.
These are not side issues: they are core problems with the approach of the book. The averaging of effect sizes across meta analyses (and then comparing these averages) is the key technique by which Hattie judges what works and what doesn’t, and thus forms his narrative about what is important in education. For example, on page 243, Hattie compares the average effect sizes for the “teacher as activator” techniques he has analysed against those for “teacher as facilitator”. On the basis that the former are higher, he concludes “These results show that active and guided instruction is much more effective than unguided, facilitative instruction”. He’s not necessarily wrong, but if we cannot trust the average effect sizes he gives as evidence, and cannot sensibly compare them, we cannot make that conclusion from this data. In which case, the book is not much use as an argument or a useful summary of the data, just as an impressive catalogue of the original meta-analyses.
Please do add comments if you disagree with any of this. As I say, I am not a statistics expert, but I’ve tried to explain my logic above so that you can follow my thinking for yourself.

Reblogged this on The Echo Chamber.
I would just like to add a couple of points that have bothered me. I have by no means completed a detailed analysis in the way that you have but these might potentially add something.
1. As Old Andrew has pointed out, there is an oddity the tracking data. Those programs where high ability students are extracted into a group that follows a different curriculum are not included. I don’t really understand Hattie’s logic for that.
2. I wonder about effect size and experimental design. For example, in the classic approach, one group gets a particular intervention e.g. problem-based learning and the other gets a control. However, these are not, and cannot be, blinded. So, the teacher and students may suffer from all sorts of placebo / Hawthorn effects; they expect the intervention to have an effect and it does. So far, so normal. This is one of the reasons for setting the bar at 0.4. But then these studies are compared with studies such as those on the worked example effect. In worked example studies, human mediation is limited; students are either given worked examples to study or problems to solve. They may have views about this, but it’s not as obvious what is ‘supposed’ to happen. If well designed, the enthusiasms of a teacher will have a minimal effect. Yet, we are comparing the former studies with the latter. I suspect the effect of worked examples is far more significant than this comparison and a d=0.57 effect size allows.
Thanks for an excellent post.
Harry
The key concern you raise seems to be: “My criticisms in the rest of the review relate to inappropriate averaging and comparison of effect sizes across quite different studies and interventions.”
You have not pointed out that Hattie addresses this issue himself on page 10: “A common criticism is that [meta-analysis] combines ‘apples with oranges’ and such combining of many seemingly disparate studies is fraught with difficulties. It is the case, however, that in the study of fruit nothing else is sensible.”
I agree that the question of comparability needs to be considered carefully when making interpretations and applying these findings to the complexities of the classroom; but so does Hattie, on the same page: ” . . . classrooms are places where complexities abound and all participants try constantly to interpret, engage or disengage, and make meaning out of this variegated landscape.” In other words, these findings are a starting point, not a definitive conclusion. See, for example, the discussion of meta-analyses of whole language approaches to reading on p.137: Hattie considers the phonics components of three “whole language” studies and what happens to the results if these phonics-linked programmes are removed. (Not good if you are a whole-language proponent.) Another example is where he considers “learning styles” meta-analyses on p.195. You cannot dismiss Hattie’s work as unreliable or lacking in interpretation or balance. Hattie claims to have read all the meta-analyses and many of the primary studies, so his consideration of the quality of studies and “how they vary across the factors we conceive as important” is something we should not dismiss lightly. This is not a superficial exercise, though it is a very large one.
Your comment about age groups and influence on effect sizes is worth bearing in mind when interpreting the results; as teachers we ought to be considered and analytical, and your reservations are appropriate. For example, Piagetian programmes with an effect size of 1.28? What does that mean? You are quite correct that we need to look much closer. That, however, is a different matter from the data itself. This study is a summary of data, not a prescription for school actions.
While it is sensible to be cautious about interpreting the results of a meta-meta-analysis, it is unfair to Hattie to suggest he expects otherwise. He has always been aware of the need for rigour, and that his work will be closely scrutinised by academics around the world. He is explicit that the results are averages, overviews, historical, and requisite of interpretation, especially when considering classroom practices. That said, he also argues the case robustly in his opening chapters for the course he has chosen. I think your piece would have been stronger had it considered his arguments.
I do think you make a very useful point about the duration of interventions when considering effect size. Hattie makes a similar point when he suggests that interventions with quite small effect sizes may be well worth implementing if they are efficient uses of resources. That is exactly how schools should look at this. Holding students back for a year, for example, or watching TV, both have very low (negative) effect sizes. Not holding students back costs nothing; however, one also has an array of possibilities as to what other interventions might be more useful. Discouraging TV in favour of homework has to be sensible. Neither of these options is expensive, but they could have sizeable benefits. On a more costly note, phonics is clearly more effective than whole language, but it may cost more – in the short term. In the long term the gains should easily pay the school back with more progress, less failure and less last-minute intervention. The data needs to be interpreted, weighed and employed judiciously to make sound strategic decisions for the benefit of students. So:
It can be disappointing for teachers that something we hoped was authoritative turns out not to be; but that is the world of research. Everything is up for re-examination. However, (in my humble opinion) nothing else comes close to the breadth and considered interpretation of Visible Learning when summing up the vast and seemingly chaotic body of educational research that has been published over the last 30 – 40 years.
Hi Horatio,
Thanks for your long and thoughtful comment. Hattie does mention some of the issues early in the book, and you’re right to pick me up on this. But I am not sure that he deals with them adequately. In particular, in chapter 2 he does not discuss the problem of what the averages mean (and whether comparison is valid) if the studies are measuring different outcomes. He says that effect sizes can measure school achievement, but taking the Cooper et al paper as an example, that was measuring self-esteem and attitudes to school, not achievement. For how many other papers is this also true? For example, several meta-analyses in table 6.2 are not measuring achievement. I don’t think Hattie has properly covered the implications of averaging these with achievement.
And again, even if they both measure achievement, if one measures achievement across a full-curriculum test (e.g. SATs) but another measures a specific reading test, the standard deviation of the latter will be lower, so the effect size will be inflated. That’s not a problem while we are only comparing different reading interventions to each other, but we can’t compare a reading intervention to a curriculum-wide intervention. For example, in table 11.1, whole language (a reading intervention) is combined with smaller class sizes (curriculum-wide intervention). My worry is that a reader who does not appreciate some of the subtleties about where the effect sizes can and can’t be averaged and compared is encouraged to take the wrong message from the data.
I am happy with many of Hattie’s individual text summaries of the meta-analyses and I do believe that the book is a very useful catalogue of meta-analyses. Most of my review focuses on the bits I am unhappy with, which is the conclusion built on top of comparing those meta analyses, and a tendency to reduce the data to the point where too much detail is lost. I agree with your observation that: the data needs to be interpreted, weighed and employed judiciously to make sound strategic decisions for the benefit of students.
I am interested to have ended up here via links from an article mentioning Ollie Orange, in that I asked the following directly to that worthy gentleman, via his blog, and got no response; I am genuinely interested in the issue that I suppose is being looked at, and which receives some attention in these comments and your review: how exactly are we going to measure teacher effectiveness? I am not arguing against anything at this stage, I just would like to know how far off I am with this:
“Thanks for this rather interesting article. I too asked John about these things recently, and I must admit that I am still scratching my head. […] I wonder about the ES issue in terms of what I understand Hattie to have been saying: was it not that the ES calculation allows us to determine [to what degree? we, naturally, ask] that element of the calculated *size effect* [the differences in the “scores”] that may be attributable to the educational intervention?
Also, in your example:
“Now we go to calculate the “Effect size” and we find that their test scores are really close together and they have a standard deviation of 0.5%.”
I assume that you have taken the mean of the SDs for each set of scores. Would the value that you were quoting result in a large ES because, with so little variability across the data sets, the attribution to the teaching process undertaken of having made that amount of difference would be indeed rather definite and complete?” [Or could it be that the group has collectively taken a fairly homogeneous collection of inputs that have resulted in skills that the teacher themselves is not particularly responsible for… as per the “gifted students” example.]
Or am I just a complete ignoramus? (Is this the “sigma scores/root n” issue?) If, as has been suggested in some of the critiques, ES is simply not to be used, how do we tease out the effectiveness of the teacher? Somewhere above, there was mention of the effect of Summer School and the range of foci; if we have interactions, it is surely going to get messy. So ditch the lot? Hattie (and Horatio) make(s) many statements, particularly in “Visible Learning for Teachers”, that the data is problematic, and the results/conclusions non-prescriptive. Hattie also points to the research *design* requirements, yet to be fulfilled, and, as I have read it, and having spoken with the man about it, we are therefore left with meta-analyses. So is this really so, so bad that we must pay no heed or not spend any time performing such calculations, etc? I have seen first hand the result of little or no attempt to evaluate teacher/programme effectiveness at the school level, and the use of resources, human and financial, is quite anxiety provoking, if I may put it mildly.
And one thing about Educational Research – how do the researchers go about making it readily available for Teachers? You, EC and the guy from Norway would help us all greatly if you published your research in a manner that nailed down how we conclusively get past the simple pre/post scores method.
Thanks,
B-)
On the general matter of effect size: I think I agree with Coe’s description that it is a slightly crude, but often necessary, way of collecting different outcomes. Let’s say I have studies from 20 states in the US, each using their own state-specific test of maths ability, but using the same intervention (let’s say, banning vs using calculators). I can’t compare the difference in test scores directly, but if I believe that the tests are measuring roughly the same things, I can use a transformation to effect size to compare the difference in test scores. There are potential issues there: if the tests are too dissimilar, we’ve lost vital information, and if the standard deviations differ for other reasons (e.g. some states allow schools to only enter their best pupils for the test) then this can upset the whole thing.
In a way, the issue is unrelated to the effect size measure itself. If I have one measure that says a film critic gave a film 4 stars (of 5), and another that says 14 of 21 people surveyed would recommend the film to a friend, I can’t directly combine those measures. I can convert them both to a percentage (80% for film critic, 66% for public) but that doesn’t mean I can sensibly compare the two. The problem is not with percentages, the problem is in comparing two things that are not sufficiently similar. Meta analyses can be a sensible tool, but there is still a matter of correct judgement as to what studies can and cannot be combined.
If we want to measure teacher effectiveness for specific teachers, the best option (but still not perfect) would be an attempt to hold all other variables constant (e.g. school, curriculum, method of assessment, incoming pupil ability) and test the learning gains. But there are some variables that are near impossible to constrain. Imagine two teachers, Hardknuckle and Softly. Hardknuckle is effective at disciplining his classes, but slightly weaker at imparting knowledge, whereas Softly is weak on discipline but better on knowledge. Obviously, if you give Softly a class of students that is inclined to be well-behaved, he will look like the better teacher, but with a tougher class Hardknuckle looks better. It’s hard to get enough data for specific teachers to rise above all the other factors. And this problem still strikes looking at a higher-level: if the within-teacher variance (the difference in the same teacher’s performance with different classes) is very high, it is hard to examine the between-teacher variance (the difference between different teachers). Naively, the answer is: more data. But I think you need to assess this sort of thing in a single large study, not by Hattie’s indirect method of comparing between-teacher effect sizes to other effect sizes when that wasn’t what the studies set out to look at.
As for researcher dissemination: academics are generally bad at disseminating their research to the public. But, as I’ve written here: https://academiccomputing.wordpress.com/2013/05/02/accessing-computing-education-research/, I think disseminating individual research studies too strongly can be harmful as a whole, as they each seem to conflict with each other, and the public get very turned off (“Researchers seem to change their minds every five minutes!”). I think where researchers really should push out their results is when they perform meta-analyses and literature surveys, which are more neatly packaged, wider summaries of a research area. These summary studies are probably the best way for teachers to consume education research, especially if they only have time to read part of research.
That’s quite a long comment, I hope it’s gone some way to address your questions.
I am very, very happy to finally have some more company in showing that Visible Learning is deeply flawed. It is amazing that more people haven’t written about these issues in the 4 years since the book was published (if I recall correctly, it’s you, me, and a guy from Norway), and that of the three people who have written about them, none of us is, as far as I can tell, working directly in the field of educational research. What does this say about the state of that field?!
As for Horatio’s comment, I would disagree or quibble with nearly every sentence, but I am especially amazed at his assertion that Hattie’s work will be “closely scrutinized by academics around the world.” It has been four years! If this is, as Horatio suggests, the best that Ed research has to offer, then the field is starting at less than zero.
Anyway, thanks for the thoughtful post.
Hi EC,
I was reading the book, got to page 9 and thought “Hang on, that common language effect size doesn’t make sense. What am I missing?” I googled and found your blog post about it. “I’m not missing anything!” So I was pleased for your original blog post confirming my thoughts.
There’s no guarantee that anyone in education research has read the book. As you say, I’m not in straight education research (I’m heavy on the computing in computing education); I’d never heard of Hattie or the book until I saw it mentioned by some teachers, which prompted me to read it. To pick on one particular issue: by my understanding you cannot sensibly average effect sizes across different outcome measures (e.g. achievement vs self-esteem). But it’s not just Hattie that does it; several of the meta-analyses I saw also seemed to make this mistake.
That does leave one skeptical about education research, but there will of course be good papers and bad in any field. The difficulty is equipping the non-researcher (and, to be honest, a lot of the researchers) to tell the difference between good and bad! Tom Bennett’s “Teacher Proof” book showed that teachers get ludicrously bad research foisted on them, but there may come an unfortunate point where teachers instead get subtly bad research pushed to them, and they do not have the knowledge to understand its limitations. Researchers should certainly be very careful to criticise teachers en masse, when researchers en masse are not necessarily any better.
You say “there’s no guarantee that anyone in ed research has read the book”, but that’s easily checked, and in fact lots of people in ed research have read the book. There been many reviews of the book and it is the most prominent meta-meta-analysis of education research (a guy named Marzano has also done work in this area, but his work seems to be slightly less famous). And the fact that Hattie seemed to be surprised by the negative probability issue when a norwegian mathemetician wrote about it two years after hattie’s book had come out suggests that ed research is not a field that is able to do its own quality control. Yes, it is great if teachers can learn to distinguish between good and bad research, but that is really not our job, and most of us simply don’t have the time or expertise. A respectable field (like physics or car repair) will be self-policing. Ed research is clearly not doing that, so I feel pretty comfortable criticizing them en masse. It’s not that any given ed researcher is incompetent (I know some lovely people who work in the field), it’s that the field is just not working well enough that we can take even the most apparently authoritative people (John Hattie, Tim Shanahan, etc.) seriously without looking into it ourselves.
In fact, I would say we are already at the “unfortunate point” where we are having bad research pushed on us. It happened on a massive scale in the US with the 2000 National REading Panel report and the associated multi-billion dollar effort (“Reading First”) to put its findings into practice. Eight years later, it was determined that the effort has been a total failure. We continue to get one cockeyed idea after another (students must tread 70% non-fiction, etc.) pushed at us under the cover of this or that totally unconvincing “research.” It is very important that teachers realize that MOST ed. research is very far from definitive, and that in most cases we would be best off ignoring it. I write that with sadness, as I am someone who really thinks science can be tremendously useful, but as I’ve looked into the research over the past couple of years I have been horrified at what I’ve seen–not so much that the research itself has been terrible, but that the researchers have not hesitated to make the wildest logical leaps in their interpretation of what the results mean for classroom practice. Anyway, thanks again for your post, and I hope you write more about this kind of thing.
Came across this via twitter, wanted to comment on the issue some other comments have brought up about ‘education research foistering dodgy approaches on, and harshly criticising, teachers’ – in my experience (a education PhD student who has worked extensively in schools) it is not the researchers THEMSELVES who are doing this, often as this post demonstrates, they are dealing with vastly complicated studies where the knowledge and ‘truth’ to be gained is far from simple or clear – the best of them are therefore rightly tentative in their claims. However, the mass media and policy makers are very often, not so. Particularly in the UK, policy-making bodies will trawl research for support for whatever hair-brained idea the latest minister has dreamed up, snatch that particular piece of research whilst often showing staggering ignorance of its context, the methodological issues, or trends in the field and use it as a stick to beat the teaching professon with.
And so we researchers sit in offices and weep.
This is a much larger issue, in my humble opinion, of the relationship between research, the media and policy-making. There have been various drives in various fields (particularly education) to ‘evidence-based-policy’, yet nearly all the research (ha!) in this area shows we are a long way from this ideal…
I agree wholeheartedly with Tom Bennett’s overall assertion that teachers should be active critics, as well as producers, of education research. There’s a common rhetoric in education research that we should aim for the ideal of medical research in terms of validity and professional autonomy. I’ve got all kinds of epistemological issues on why we can’t treat education interventions the same way we treat the injection of a drug, but I think if researchers and the teaching profession were able to forge a strong, mutually respectful and collaborative relationship, we could command the same (relative) repect and freedom from constant policy tweaking that medical care enjoys.
Hope to see some of you at ResearchEd13 to start making this dream a reality!
I’d like to think it’s not the researchers themselves who are making dodgy claims, and I do think that journal articles tend to be much more circumspect in their claims, but all too often it IS the researchers themselves, often in articles for the popular press, who make the overstated claims. In the case of John Hattie’s Visible Learning, the errors are not just overstating and making logical leaps, but calculation and comparison errors that make me suspicious of Hattie’s mathematical competence and of his entire project.
As a teacher, I feel that there are much larger problems with the sheer premise of the book. It is this – given that test are both deeply flawed and not indicitive of learning how can a study that is based on many tests ever be worthwhile? As far as I can see he way a study is seen as being effective or not effective is with a test at the end and the comparison of test scores. As Bjork has pointed out that test scores are indicative of performance and not learning, all we can show is that some things increase performance more than others, not necessarily increasing ‘learning’.
In fact the most humerous thing about the book is that the title is an oxymoron – ‘Visible Learning’ is one thing that probably doesn’t exist as learning is invisible, it is performance that you can see.
Thank you so much for your well-reasoned post. You are wiser than a lot of statistical experts.
In a nutshell, meta-analysis swaps accuracy for precision. Yes, by congealing numerous studies you can drive up the precision to the point of statistical significance. But at some point you lose sight of what you are actually measuring.
A meta-analysis of meta-analyses is just plain ridiculous.
I’ve had issues with Hattie ever since he claimed that streaming makes no difference on learning. As a High School Maths teacher of over 15 years I would have to whole-heartedly disagree and believe streaming enables more students to achieve their potential than mixed-ability teaching would. This might not be the case in the perfect mixed-ability primary classroom but for me, mixed-ability teaching is a nightmare.
It is dangerous when managers read Hattie’s conclusions and want them implemented without questioning his approaches. So thank you for this article.
A really interesting discussion. After a first career in statistics (over 20 years), I am now training to become a maths teacher. I am utterly amazed at the dearth of academic critiques of this book. (If anyone has any suitable references, please post them.)
From a superficial reading of this book, it seems obvious that the results, particularly the final ranking of effects – which have been alarmingly propagated and now appear to be gospel – are at best misleading. However, having said that I have not had time or resources needed to thoroughly checking this. But I’m heartily skeptical.
I am a former student of professor Topphol, “the guy from Norway.” He has been teaching math at the Teacher training College in Volda, Norway for 20 years. He is an excellent mathematician who also have a head for common sense. What he is implying, and he is very careful and covering his back 🙂 is that when you approach a subject scientifically and you have a fault, none of your research is trustworthy. If the material is wrong, it is not scientifically and should not be treated as such. He would of course never write it, I am just giving him a clarifying hand.(Or not). Or I do the same mistake as Hattie, make the wrong assumptions. As Keynes wrote regarding to economics. “Economic development can not be written in algebraic equations, because the factors are dependent on each other.” I guess I can quote Keynes regarding Hattie too. Just change economical with educational. Keynes who, was not well liked for his honesty, wrote that most economic theories that where written was mostly rubbish. Topphol who is well liked, would never have uttered such a statement regarding education. (In public:-)
Another dude from Norway 🙂
A big worry is that many administrators who lack an understanding of quality of data quote Hattie as gospel. They also freely abuse and misquote it.
Thanks Neil for a thoughtful and thorough analysis, I too echo Sam’s post “that many administrators who lack an understanding of quality of data quote Hattie as gospel. They also freely abuse and misquote it.” It is interesting to note that organisational issues like class size, length of school day, etc have a low effect size; meaning administrators and governments can save huge sums of money – no wonder they like Hattie! So it is difficult for the average teacher to argue against their superiors, as it will be held against them. So most teachers don’t bother and just accept that this a fad and wait for the next fad to arrive ( i wonder what that will be?). However, this post has convinced me what i have felt all along: that at best Hattie’s statistics are dodgy and at worst are absolutely misleading and are distracting us from more important issues (like company lobbying in Educational policy).
Thanks Neil, in your example of effect size with the students studying French, can you compare the same group pre and post and get an effect size? Or must it be compared to another group, eg the group that didn’t go to France, to see if that variable of travel had an effect compared to the group who stayed home?
Hi GP,
You can produce an effect size for comparing pre- and post- groups, or you can produce an effect size between control and treatment groups. Both are sensible comparisons, and it is valid to calculate an effect size in each case. However, it is not necessarily valid to compare those two kinds of effect size (especially depending on the control). You’d probably expect a bigger difference, for example, between before summer school and after summer school, than between a standard summer school (control) and a summer school with an innovative pedagogy (treatement). One of the key problems in the book is that it compares and aggregates across effect sizes without considering the context that they came from.
It’s like saying that women playing football in the UK increased 20% last year, but men playing football increased 2%, so women’s football is doing better; just because it’s the same measure (percentage growth), doesn’t mean a comparison between the two is sensible without considering the context. (Women’s football starting from a low base, men’s football has probably reached saturation point, etc.)
thanks Neil, what do you think of the effect size calculation Hattie uses in the greatest effect size “Self report grades” where a student’s prediction of their test score is pre-test and the teacher’s assessment is the post-test?
George: I don’t remember that one. It seems like a valid comparison to make (“how accurate are students’ predictions?”), but it clearly doesn’t tell you anything about improved learning. If anything, you could argue that a lower effect size there is better, because it means the students are more accurate in their predictions. I’d suspect that better accuracy in grade prediction would be better for the students, but that’s just intuition.
Thanks Neil, I will double check how Hattie calculated the Effect size for these. One other thing puzzled me when Hattie uses effect sizes to describes the rates of learning, for example an average effect size of homework is d = 0.29; He says that this is equivalent to advancing a child’s achievement by 1 year.(p8). Then the high effect size 1.44 of “self reported grades” would equate to accelerated learning of 2-3 years. Which is pretty amazing. Do you know how he arrived at that? He does not seem to explain this.
From memory, the year of achievement is measured by taking student’s performance on some standardised test(s) at the beginning of a school year, then at the end and calculating an effect size. e.g. give students mock GCSE papers at start of year 11, average might be 60% with standard deviation (S.D.) 20%, then in real GCSEs at end of year 11, mean is 66% with same S.D., effect size is 6/20=0.3.
The problem with comparing this effect size to the other studies rounded up in the book is that the effect sizes measure different things. You may have some intervention which boosts trigonometry scores by an effect size of 0.6, and claim this is 2 years’ progress. But because it is a much narrower test, the S.D. will be lower which means the effect size will be higher. To make a proper comparison, you’d need to check their performance on the same standardised tests. That trigonometry intervention might raise maths marks on the GCSE by 3% points with S.D. of 5% (0.6 effect size on maths specifically), which translates into a 0.3% raise across ten GCSEs, which would be an effect size of 0.03 on the standardised tests. Decent, but now sounds much less impressive.
Thank you Neil for your quick response. Do you find it a bit odd that the terminology ‘effect size’ has a few different uses? Is there a reason to this? (I’m thinking specifically for the pre-post single group and the two group mean comparison, control and experimental)
Also, if you were getting large effect sizes (over 1) on pre-post test data over short cycles (eg 10 weeks), does that mean there’s something wrong with the test paper, or the sample size is too small, or is it ok?
Is there a certain number of questions that makes the test data more vaild in this pre-post scenario? Eg 10 question test as opposed to a 30 question test. Thanks Neil
GP: an effect size is just a generic tool. In the same way that a p-value can be used in all sorts of contexts but is given meaning by the test it arose from, so effect size can be used everywhere but is given meaning by its context. It’s not wrong that it can be used in multiple scenarios, but the central issue in the book is that the context is being too easily discarded in the name of aggregation. Especially this repeated oddity of comparing pre-post effect sizes to control-treatment effect sizes.
I think a large effect size over a short space of time is definitely suspicious. I would suspect some combination of data massaging, poor tests, small sample size and noisy data. Or just “bloody obvious result”. If I took a bunch of kids who had never studied Spanish, and tested their performance on a Spanish test before and after a ten week Spanish course, I could probably achieve a pretty amazing effect size. (But that doesn’t mean that teaching every kid Spanish is the best thing a school could do to raise their maths or english scores or whatever is important in the larger picture.)
The test would definitely matter. Taking the base case, a one question test would be quite narrow in what it assessed and have a fairly large standard deviation. More questions is not necessarily always a better test if the questions are low quality, but there is clearly a sensible minimum somewhere, and a comprehensive test would tend to be larger (but you have to beware factors like participant boredom, limits to concentration, etc).
Thank you Neil, have appreciated your insights.
Thanks Neil i looked up the 5 meta-analysis Hattie used for the influence of “self-reported” grades. One of the meta-analysis: Fachikov & Boud (1989): Student Self-Assessment in Higher Education; explain how they calculated effect size – ‘… self-assessment studies are, in most cases, not “true” experiments and have no experimental and control groups in the traditional sense, staff markers were designated as the control group and self-markers the experimental group.’ P416
They conclude, “the greater the effect size, the less the self-marker ratings resemble those of staff markers.” P417
So high effect sizes, in this case, indicates students are over-rating themselves, not that self-rating improves performance, as Hattie infers.
Do we completely reject Hattie’s list because of its faults? I suggest not.
First let’s ignore the top two in the list because they are correlations,not effect-sizes.
Then, let’s ignore the CLE number in the table. It’s faulty and,anyway, it wasn’t used to create the list.
Then let’s ignore the actual effect-size number because it is probably inflated by the selection of evidence.
What we are left with is a list in rank order.
Now, let’s not believe this list unless it ties in with other lists which try to do similar things, eg Marzano and EEF (Education Endowment Foundation).
What we then see is that all three lists are largely consistent. You don’t find one thing at the top of Hattie’s list and at the bottom of the EEF list.
That’s interesting! That makes us more sure.
But let’s now not believe even these three lists (for any of the learned reasons given above) unless they correlate with cognitive science. Again, we find that although we don’t get exactly the same messages, there is no serious inconsistency. We don’t get the cog sci people telling us memories need several spaced repeats and the ‘list’ people saying they have found long-term memories can be formed in a lesson.
Now let’s not believe any of it. Let’s stand back and see if it all adds up to a big-picture explanation of the learning process. Can we combine all this material to give us an overview.
I suggest that the outline of this ‘big-picture’ (or even ‘theory of learning’) already exists.
When evidence-based professionals have looked at the evidence for a while, long before they are sure of the new theory, they start to use it to make predictions. They then go looking for evidence which supports or refutes their hypothesis. If they can make predictions which seem to go against the conventional wisdom or ‘common sense’ and, if they are proved correct, then the theory starts to look resilient.
Luckily enough, so many different experiments have already been done in education that the evidence is almost always sitting there waiting for us.
We have attempted to ‘have a go’ at this shared big-picture. Take a look. It doesn’t look like Hattie’s Visible Learning course!
We suggest there are 6 main steps in the learning process and that all the high-effect methods, ideas about working and long-term memory etc can be included in these sections. What’s more, I reckon any teacher can apply the six-steps to any module they are teaching.
However, please don’t do what some have done above: pick holes and dismiss the whole thing. If you think the whole thing is wrong, good luck to you. If you see flaws or have suggestions for improvement, please say!
On Monday morning 1000s of teachers go into classrooms. Let’s give them the best we have as guidance.
http://www.ebtn.org.uk/evidence/6-steps
I find it surprising that you would argue against getting better evidence given you run an evidence-based consultancy.
Your colleague Geoff Petty made the same argument in David Didau’s critique about Hattie. Didau’s response is apt here-
“so you’re argument is along the lines of democracy is the best worst form of government? I can accept that, but to then say, don’t critique when people do it badly seems absurd. Surely it’s more sensible to accept that improvement is iterative and by acknowledging our mistakes and failures we can refine and improve the process of measurement and comparison?”
Even Hattie himself argues for more scrutiny-
At the 2005 ACER conference (p14) Hattie said, “We must contest the evidence – as that is the basis of a common understanding of progression.” Then in Visible Learning he quotes Karl Popper: “Those amongst us unwilling to expose their ideas to the hazard of refutation do not take part in the scientific game” (p4).